Différentes façons de réorganiser et de présenter les résultats de l’atelier
Il existe de nombreuses façons d’organiser les cartes de chemin d’impact, mais toutes les cartes passent par plusieurs étapes de développement. Les pages suivantes présentent des exemples des trois étapes de l’analyse des données, lors d’un atelier organisé à Lyon avec VRAC, une association qui organise dans les quartiers à faibles revenus des groupes d’achat en vrac de produits de l’agriculture biologique/agricole/équitable, vendus à prix coûtant.
Exemple de trois étapes de traitement des données
Étape 1 :
Carte de chemin d’impact à la fin d’un atelier, commençant par une activité à gauche, et allant jusqu’aux changements et aux impacts à droite, avec facilitateurs et obstacles identifiés en cours de route. Il s’agit d’une seule des neuf cartes conçues au cours de l’atelier, chacune d’entre elles représentant une activité différente. Chacun des trois groupes de travail a travaillé successivement sur la même carte, en utilisant une couleur différente. Aucune attention particulière n’a été portée à la distinction entre les impacts sur les différentes dimensions de la durabilité (pas de drapeaux de couleur).
Workshop Map
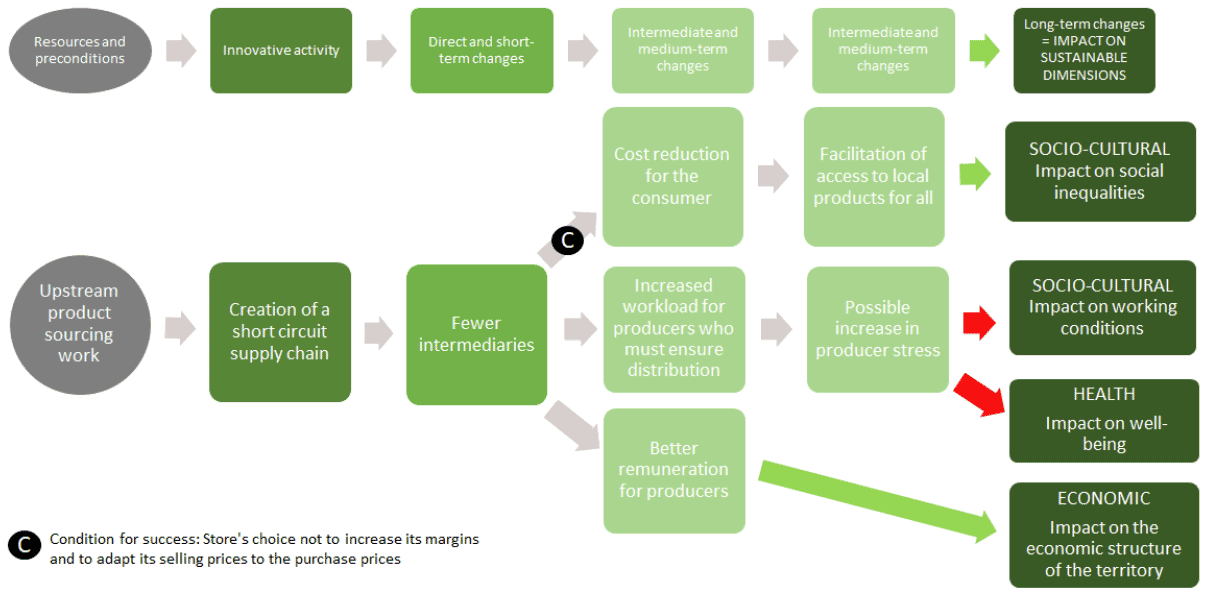
Étape 2 :
Numérisation de la carte avec ajout des conditions, des freins et des leviers de changement (sur la base des discussions en ateliers et des entretiens de l’étape 1). La numérisation de la carte permet d’en avoir une vision plus claire et l’objectif est de créer une vue d’ensemble des chemins d’impact identifiés dans les groupes de discussion. (source : Castellano, Rigaud & Valette, 2022)
Réorganisation de la carte qui inclut (1) des éléments complémentaires issus des entretiens de l’étape 1 (en gras) ;
(2) le positionnement de chaque élément pour relier l’identification et le nom de l’impact sur chaque dimension de la durabilité ; (3) la réflexion sur les chemins ; et (4) les conditions de réussite, les leviers et les obstacles au changement, avec des couleurs différentes pour signifier les impacts négatifs ou positifs.
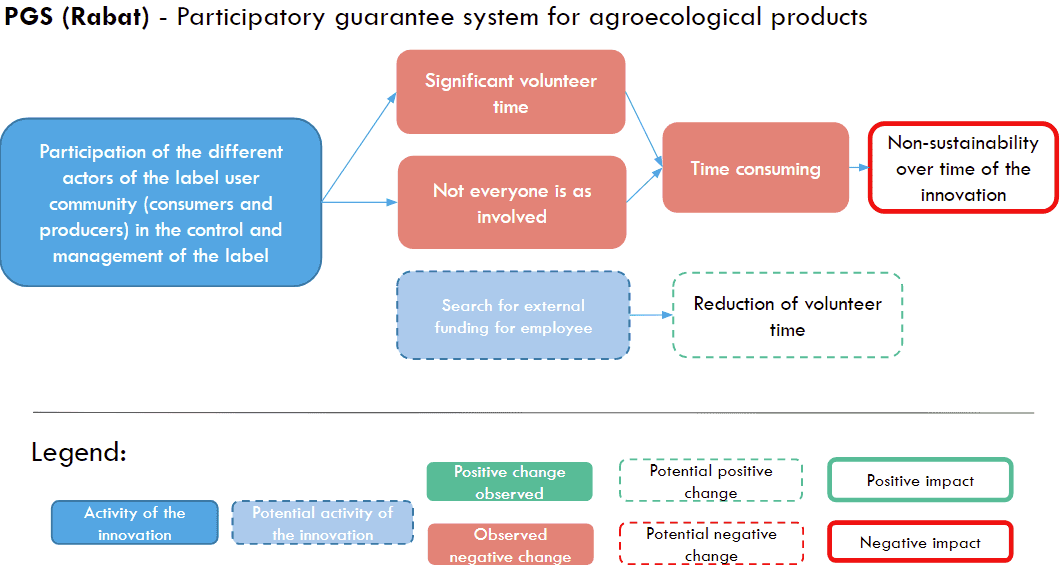
Il existe d’autres options pour présenter les résultats de l’atelier. Par exemple, vos résultats peuvent être organisés de manière à présenter les principaux impacts pour chaque dimension de la durabilité. Vous pouvez également résumer les principales conclusions de la carte dans un court texte qui complète la carte (voir le livret UFIL Lyon).
Les cartes obtenues au cours de l’atelier peuvent également être réorganisées en fonction de divers besoins. Par exemple, il peut être utile de sélectionner les résultats que vous partagez en fonction des intérêts de différents publics. Dans le cas de La Panaméenne, un restaurant et une épicerie parisiens qui se concentrent sur le développement des compétences et l’emploi des femmes immigrées vivant dans des conditions précaires, les résultats ont été réorganisés pour présenter les impacts sur trois publics clés : les femmes travaillant dans l’organisation, les clientes elles-mêmes et le quartier environnant. Le fait d’organiser ainsi les cartes de chemin d’impact a permis de démontrer clairement comment ces groupes clés sont affectés par l’innovation.
Resources
Evaluation-URBAL-Panameenne-Paris
Evaluation d'impact
Cagette enquête
Evaluation participative Urbal de l'association Vrac Lyon
Comprendre les changements et les impacts d’une innovation
Mieux saisir les enjeux et identifier les catalyseurs d’une innovation
Potentiellement suivre et évaluer l’impact des innovations financées
Evaluer le potentiel d’une innovation en termes d’impact sur une durabilité à plus long terme.
Chercheurs et chercheuses,
Urbal peut vous aider à :
Mieux comprendre les innovations pour une alimentation durable, et comment elles contribuent à l’autonomisation et à la durabilité des systèmes alimentaires
Rassembler acteurs et actrices de ces innovations au sein de collectifs multi-acteurs, pour produire des évaluations inclusives et représentatives, fondées sur l’intelligence collective
Identifier les freins et les leviers des innovations
Développer éventuellement des indicateurs pour suivre et évaluer les progrès vers la durabilité.
Décideurs et décideuses politiques,
Urbal peut vous aider à :
Structurer un panorama des innovations pour une alimentation durable œuvrant dans votre territoire
Comprendre, intégrer et promouvoir ces innovations
Acquérir les connaissances dont vous avez besoin pour renforcer des politiques alimentaires durables, et surmonter les obstacles à la durabilité des systèmes alimentaires.
Développer et améliorer l’évaluation des innovations pour une alimentation durable
Utiliser les données probantes d’Urbal pour développer des programmes et politiques plus adaptés.
Acteurs et actrices des innovationspour une alimentation durable,
Urbal peut vous aider à :
Comprendre et guider vos actions pour remplir des objectifs de durabilité
Recueillir les informations dont vous avez besoin pour prendre de meilleures décisions
Communiquer clairement la valeur de votre innovation aux publics concernés, et ainsi attirer davantage de financement
Créer un réseau au sein de votre territoire
Développer si vous le souhaitez des indicateurs pour suivre et évaluer vos progrès vers la durabilité.
Scale
The capacity of single initiatives to contribute to the transformation of sustainable food systems is weak if they are not likely to be replicated, imitated, networked, amplified, supported and disseminated at multiple scales (scaling capacity).
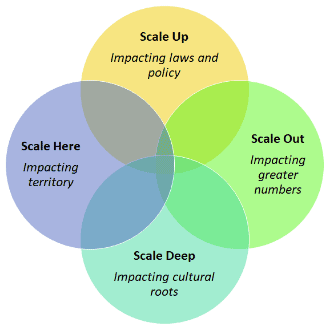
It is useful to consider different ways of scale for an innovation (Riddell and Moore, 2015):
“Scaling out” is impacting greater numbers. Strategies may include the replication or the spreading of projects and programs geographically and/or to greater numbers, or the dissemination of principles, knowledge, experiences, with the adaptation to new territorial contexts.
“Scaling up” is about impacting laws and policy (in legal terms, policy governance, commodity chain structuring, etc.),
“Scaling deep” is impacting cultural roots. That means spreading big cultural ideas and using stories to shift norms and beliefs, or investing in transformative learning and communities of practice.
“Scaling here” ?
Urbal can, through the participatory method and result sharing, accompany changes of scale by strengthening the capacity of practitioners to disseminate their innovations and contribute to the transition towards more sustainable food systems.
How? It helps stakeholders to reflect on the conditions, barriers and levers to spread their innovations to other scales.
According to Bouchard, Evers & Fraisse (2015), social innovation is an “intervention initiated by social actors to respond to an aspiration, meet a need, provide a solution or take advantage of an opportunity for cultural action in order to modify social relations, transform a framework of action or propose new orientations. From this point of view […] social innovation aims to modify the institutional frameworks that shape relationships in society”.
In URBAL, we consider social innovations when found the following characteristics:
They want change, responding to a social or societal need or seizing an opportunity for activating minor or major changes in society (Chiffoleau 2016).
They Are inclusive, seeking to benefit the whole society by the sharing of the value produced (economic, social, environmental,…)
They include collaborative or participatory activities.
There is therefore an intentionality to change the situation in relation to the previous situation, to improve one or more aspects of the life of individuals.
Social innovations are embedded in a value system, they are not intrinsically good and what is undesirable (problems) and desirable (solutions) can change over time.
Ressources
Video/pictures: rechercher l’interview de Veronica sur la définition d’innovation sociale (?) (Elodie ?)
Shared experiences and feedbacks from other users:
Urbal tools to help users :
In-depth insights to download: Master thesis Veronica : BONOMELLI V. Building a participative tool to map the impact pathway of urban driven innovations on food systems sustainability: how to consider specific features of social innovation? : Master thesis. Montpellier Supagro, 2018, 50p, So What 14.
Urbal participatory tools
Participatory engagement is at the heart of the Urbal methodology.
This approach relies on experts (not necessarily scientists but people with long experience and/or professional knowledge) and practitioners to be successful and provide useful insights. This means that all knowledge and experiences are equally valuable and valid.
A participatory process helps people to engage with others and reinforces stakeholders’ understandings and relationships.
A participatory process requires skills and tools supported by Urbal.
Ressources
Shared experiences and feedbacks from other users:
To enter the logic of the URBAL method at this point you can ask what has changed since the implementation of the innovative activity, namely the path of change that was triggered by the activity. In order to answer this question, you use an Urbal’s representation of an impact pathway. Impact pathway: a graphical chart that maps how an activity can generate short-term and medium-term changes to achieve long-term changes also called impacts. Changes : transformations/consequences induced by an innovative activity Impact: long-term changes linked to sustainability, caused by short and medium changes.
Ressources
Video/pictures: Pictures of the explanation of what an impact pathway is (see above) Ask Està to make it clean → Visual
Shared experiences and feedback from other users: example of an impact pathway completed by the participants (MIRI) – PDF files :
Urbal tools to help users : example of impact pathway map to be completed (Example of Milano Ristorazione → tool to ask Està to do in English . The columns include: innovative practice, activities, short-term changes, medium term and long term changes/impacts, sustainable dimension, factors (with drivers and barriers).
A sustainable food system “provides healthy food to meet current food needs while maintaining healthy ecosystems that can also provide food for generations to come, with minimal negative impact to the environment; encourages local production and distribution infrastructures; makes nutritious food available, accessible, and affordable to all; is humane and just, protecting farmers and other workers, consumers, and communities.”
(Story et al. 2009). (Ref: Story M, Hamm MW, Wallinga D (2009) Food systems and public health: linkages to achieve healthier diets and healthier communities. J Hunger Environ Nutr 4:219–224).
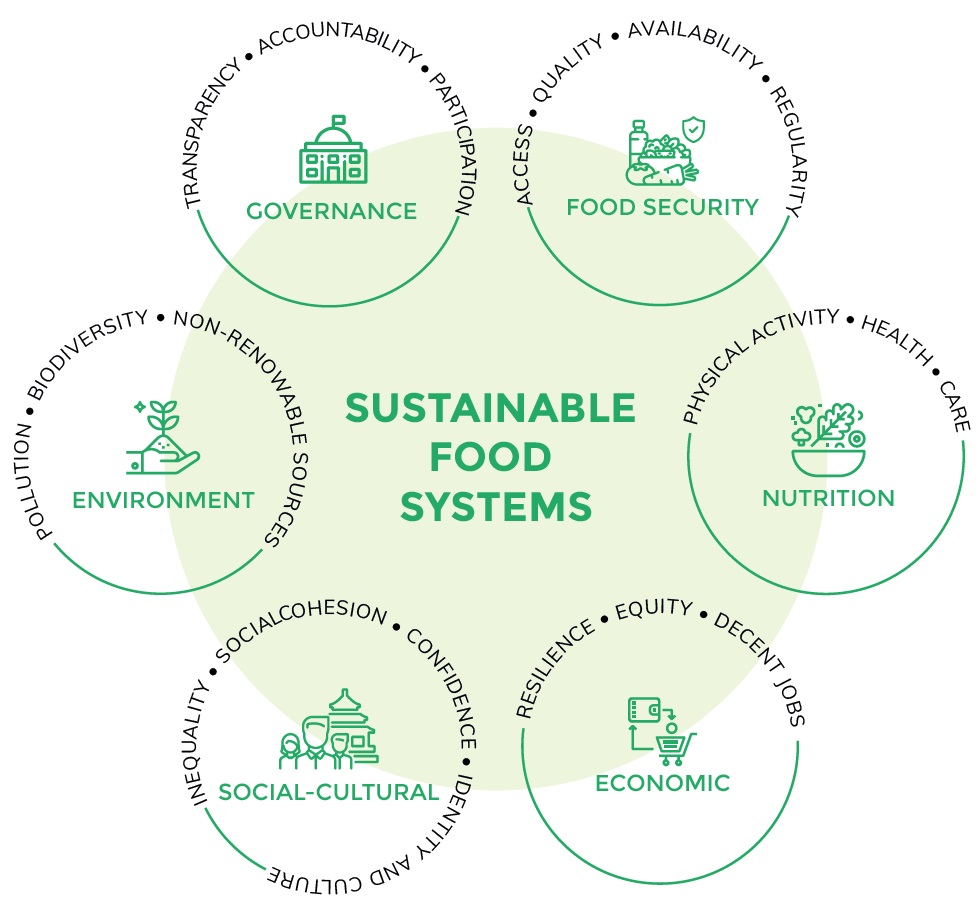
There are many different opportunities to make the world we live in more sustainable through food systems. The key Urbal dimensions of sustainability are:
Governance : transparency, power dynamics, people’s participation, accountability…
Environment : protection of biodiversity, renewable resources, energy efficiency, climate resilience…
Social-cultural : equity, community building, confidence in the system, positive expression of social and cultural identity and culture…
Economic : equity, resilience, fair work and remuneration, local economies…
Ressources
Video/pictures: diagram of the dimensions of sustainability à voir avec Està → visual to research external brief explanatory pedagogical videos (Ophelie looks in the resources of the Unesco Chair and in the URBAL video) → visual
Shared experiences and feedbacks from other users: n/a